Viacom Reports Fourth Quarter and Full Year Results
- Grew Domestic Advertising Revenue 6% for the Quarter and 1% for the Full Year
- Achieved Domestic Affiliate Revenue Growth of 1% for Both the Quarter and Full Year
- Returned
Paramount to Profitability, with Full Year Adjusted Operating Income Improvement of$117 Million - Accelerated Viacom’s Evolution with Continued Growth at Advanced Marketing Solutions – including Pluto TV – and Studio Production
This press release features multimedia. View the full release here: https://www.businesswire.com/news/home/20191114005222/en/
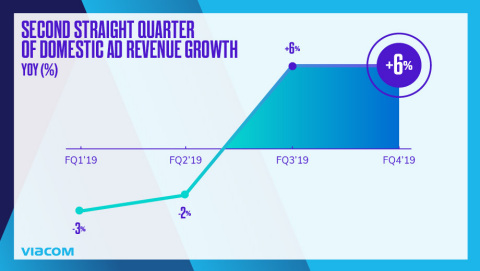
Domestic advertising revenue grew 6% in the quarter, driven by the continued success of Advanced Marketing Solutions. (Photo: Business Wire)
Statement from
“Our strong performance in the fourth quarter capped off a pivotal year for
| Quarter Ended September 30 | Full Year Ended September 30 | |||||||||||||||||||||||||||||||||||||||||
|
2019 |
2018 |
B/(W) % | FX IMPACT % |
CONSTANT CURRENCY BASIS %† |
2019 |
2018 |
B/(W)% | FX Impact % | CONSTANT CURRENCY BASIS %† |
|||||||||||||||||||||||||||||||||
| GAAP | ||||||||||||||||||||||||||||||||||||||||||
| Revenues |
$ |
3,433 |
$ |
3,485 |
(1 |
) |
% |
(1 |
) |
% |
- |
% |
$ |
12,838 |
$ |
12,943 |
(1 |
) |
% |
(2 |
) |
% |
1 |
% | ||||||||||||||||||
| Operating income |
530 |
646 |
(18 |
) |
2,462 |
2,572 |
(4 |
) |
||||||||||||||||||||||||||||||||||
| Net earnings from continuing operations attributable to Viacom |
303 |
386 |
(22 |
) |
1,522 |
1,688 |
(10 |
) |
||||||||||||||||||||||||||||||||||
| Diluted EPS from continuing operations |
0.75 |
0.96 |
(22 |
) |
3.77 |
4.19 |
(10 |
) |
||||||||||||||||||||||||||||||||||
| Non-GAAP† | ||||||||||||||||||||||||||||||||||||||||||
| Adjusted operating income |
$ |
572 |
$ |
671 |
(15 |
) |
% |
(3 |
) |
% |
(12 |
) |
% |
$ |
2,716 |
$ |
2,797 |
(3 |
) |
% |
(1 |
) |
% |
(2 |
) |
% | ||||||||||||||||
| Adjusted net earnings from continuing operations attributable to Viacom |
321 |
400 |
(20 |
) |
(6 |
) |
(14 |
) |
1,641 |
1,659 |
(1 |
) |
(3 |
) |
2 |
|||||||||||||||||||||||||||
| Adjusted diluted EPS from continuing operations |
0.79 |
0.99 |
(20 |
) |
(6 |
) |
(14 |
) |
4.06 |
4.12 |
(1 |
) |
(2 |
) |
1 |
|||||||||||||||||||||||||||
| † Non-GAAP measures referenced in this release are detailed in the Supplemental Disclosures at the end of this release. | ||||||||||||||||||||||||||||||||||||||||||
FILMED ENTERTAINMENT
Financial Results
|
$ millions |
|||||||||||||||||||||||||
| FQ4'19 | TOTAL | B/(W)% | DOMESTIC | B/(W)% | INT'L | B/(W)% | |||||||||||||||||||
| Revenues |
$ |
851 |
(14 |
) |
% |
$ |
474 |
19 |
% |
$ |
377 |
(35 |
) |
% | |||||||||||
| Theatrical |
94 |
(72 |
) |
48 |
(56 |
) |
46 |
(80 |
) |
||||||||||||||||
| Home Entertainment |
153 |
(3 |
) |
101 |
(2 |
) |
52 |
(4 |
) |
||||||||||||||||
| Licensing |
550 |
26 |
284 |
92 |
266 |
(7 |
) |
||||||||||||||||||
| Ancillary |
54 |
(2 |
) |
41 |
- |
13 |
(7 |
) |
|||||||||||||||||
| Expenses |
797 |
16 |
|||||||||||||||||||||||
| Adjusted OI |
$ |
54 |
42 |
% | |||||||||||||||||||||
| FY'19 | TOTAL | B/(W)% | DOMESTIC | B/(W)% | INT'L | B/(W)% | |||||||||||||||||||
| Revenues |
$ |
3,079 |
1 |
% |
$ |
1,639 |
8 |
% |
$ |
1,440 |
(6 |
) |
% | ||||||||||||
| Theatrical |
567 |
(18 |
) |
268 |
(19 |
) |
299 |
(18 |
) |
||||||||||||||||
| Home Entertainment |
646 |
4 |
425 |
11 |
221 |
(8 |
) |
||||||||||||||||||
| Licensing |
1,606 |
5 |
776 |
18 |
830 |
(5 |
) |
||||||||||||||||||
| Ancillary |
260 |
33 |
170 |
20 |
90 |
70 |
|||||||||||||||||||
| Expenses |
3,001 |
3 |
|||||||||||||||||||||||
| Adjusted OI |
$ |
78 |
NM |
% | |||||||||||||||||||||
| All figures are presented on a reported segment basis as impact from foreign exchange is not material. | |||||||||||||||||||||||||
| NM - Not Meaningful | |||||||||||||||||||||||||
- Full year adjusted operating income grew by
$117 million YOY.
− For the quarter, adjusted OI increased 42% to
- Full year revenue growth of 1% was principally driven by licensing and ancillary revenues, which were partially offset by lower theatrical revenue.
− Licensing revenue increased by 5% for the full year and 26% for the quarter, driven by growth in TV production.
− Ancillary revenue grew 33% for the full year, driven by higher licensing fees from international theme parks and a new music rights agreement.
− Theatrical revenue declined reflecting the comparison to Mission: Impossible – Fallout in the prior year.
Operational Highlights
- During the quarter, Crawl and Dora and the Lost City of Gold performed well at the box office.
− Crawl generated over
− Dora and the Lost City of Gold drove over
- Paramount’s fiscal year 2020 film slate is at 17 films versus 11 in the prior year.
− Looking forward, highly anticipated releases include A Quiet Place Part II, The Spongebob Movie: Sponge on the Run and Top Gun: Maverick.
- Paramount Television continues to grow and deliver great content, with 26 shows ordered to or in production.
− Third season of 13 Reasons Why premiered on
− Looking For
− Second season of Tom Clancy’s
- Beyond its core business,
Paramount expanded and reached new theme park licensing deals inLondon ,Korea ,China and theMiddle East over the course of the fiscal year.
MEDIA NETWORKS
Viacom Media Networks achieved full year growth in domestic advertising and affiliate revenue, driven by continued acceleration in Advanced Marketing Solutions and advancement in Viacom’s distribution strategy.
Financial Results
| $ millions | ||||||||||||||||||||||||||||||||||||||||
| FQ4'19 |
TOTAL |
|
B/(W)% |
|
FX |
|
Constant |
|
DOMESTIC |
|
B/(W)% |
INT'L |
B/(W)% |
|
FX |
|
Constant |
|||||||||||||||||||||||
| Revenues |
$ |
2,614 |
4 |
% |
(2 |
) |
% |
6 |
% |
$ |
2,028 |
3 |
% |
$ |
586 |
6 |
% |
(9 |
) |
% |
15 |
% | ||||||||||||||||||
| Advertising |
1,163 |
1 |
(3 |
) |
4 |
946 |
6 |
217 |
(14 |
) |
(12 |
) |
(2 |
) |
||||||||||||||||||||||||||
| Affiliate |
1,331 |
6 |
(2 |
) |
8 |
1,004 |
1 |
327 |
27 |
(7 |
) |
34 |
||||||||||||||||||||||||||||
| Consumer Products, |
120 |
(1 |
) |
(2 |
) |
1 |
78 |
3 |
42 |
(7 |
) |
(5 |
) |
(2 |
) |
|||||||||||||||||||||||||
| Recreation & Live Events* | ||||||||||||||||||||||||||||||||||||||||
| Expenses |
2,017 |
(11 |
) |
2 |
(13 |
) |
||||||||||||||||||||||||||||||||||
| Adjusted OI |
$ |
597 |
(16 |
) |
% |
(3 |
) |
% |
(13 |
) |
% | |||||||||||||||||||||||||||||
| FY'19 |
TOTAL |
|
B/(W)% |
|
FX |
|
Constant |
|
DOMESTIC |
|
B/(W)% |
INT'L |
B/(W)% |
|
FX |
|
Constant |
|||||||||||||||||||||||
| Revenues |
$ |
9,883 |
(1 |
) |
% |
(2 |
) |
% |
1 |
% |
$ |
7,806 |
1 |
% |
$ |
2,077 |
(8 |
) |
% |
(10 |
) |
% |
2 |
% | ||||||||||||||||
| Advertising |
4,652 |
(2 |
) |
(3 |
) |
1 |
3,649 |
1 |
1,003 |
(13 |
) |
(13 |
) |
- |
||||||||||||||||||||||||||
| Affiliate |
4,828 |
1 |
(1 |
) |
2 |
3,897 |
1 |
931 |
1 |
(7 |
) |
8 |
||||||||||||||||||||||||||||
| Consumer Products, |
403 |
(12 |
) |
(2 |
) |
(10 |
) |
260 |
(6 |
) |
143 |
(21 |
) |
(5 |
) |
(16 |
) |
|||||||||||||||||||||||
| Recreation & Live Events* | ||||||||||||||||||||||||||||||||||||||||
| Expenses |
6,943 |
(1 |
) |
3 |
(4 |
) |
||||||||||||||||||||||||||||||||||
| Adjusted OI |
$ |
2,940 |
(6 |
) |
% |
(1 |
) |
% |
(5 |
) |
% | |||||||||||||||||||||||||||||
| * Beginning Q1 2019, Media Networks revenue components previously reported as Ancillary were renamed to Consumer Products, Recreation and Live Events. Furthermore, certain components previously reported as Ancillary were reclassified to Affiliate. Prior period amounts have been recast to conform to the current presentation. | ||||||||||||||||||||||||||||||||||||||||
| † Non-GAAP measures referenced in this release are detailed in the Supplemental Disclosures at the end of this release. | ||||||||||||||||||||||||||||||||||||||||
- Driven by the continued success of Advanced Marketing Solutions (AMS), domestic advertising revenue grew 1% for the full year, representing its first full year of growth in six years.
− AMS revenue grew 76% for the full year.
− For the quarter, domestic advertising revenue grew 6%, benefiting from 83% growth in AMS revenue.
- Domestic affiliate revenue increased 1% for the full year and quarter, driven by higher OTT and studio production revenue and contractual rate increases, which were partially offset by subscriber declines.
- Viacom International Media Networks delivered strong revenue growth, benefiting from SVOD and studio production gains.
− On a constant currency basis, international revenue grew 2% for the full year and 15% for the quarter. †
- Adjusted OI was impacted by investments in key growth initiatives, including Pluto TV and the launch of BET+.
Operational Highlights
- Viewing performance in the quarter and year:
− Domestic Media networks continued to gain audience share with the total portfolio up 2% YOY for the quarter and achieving growth for the full year.
−
− Internationally, Telefe remained #1 in ratings, while Channel 5,
- Licensing agreements:
− Licensed South Park streaming rights to HBO Max, demonstrating the appeal and value of Viacom IP.
- Next generation platforms:
−
− Viacom International Media Networks reached several new distribution deals for Viacom’s owned and operated SVOD and mobile apps.
- Pluto TV continued to scale:
− Monthly active users rose to approximately 20 million domestically, up nearly 70% this calendar year.
− Launched 43 new channels, including 24
−
- Studio production & live events:
− Media Networks studio production continues to expand, with 17 domestic series ordered to or in production, up from 6 last year.
− Nickelodeon Studios announced a new multi-year output deal to produce original animated films and series for
− Driven by Viacom Digital Studios,
−
BALANCE SHEET AND LIQUIDITY
- At
September 30, 2019 , gross debt outstanding was$8.74 billion , a 13% reduction fromSeptember 30, 2018 . Adjusted gross debt was$8.09 billion . - For the full year ended
September 30, 2019 , net cash provided by operating activities declined year-over-year to$1.58 billion and free cash flow declined to$1.38 billion , driven by higher cash taxes and lower operating income. - Repaid
$1.35 billion of senior notes and debentures, including$220 million that matured in September.
About
For more information about
Cautionary Statement Concerning Forward-Looking Statements
This news release contains both historical and forward-looking statements. All statements that are not statements of historical fact are, or may be deemed to be, forward-looking statements. Forward-looking statements reflect our current expectations concerning future results, objectives, plans and goals, and involve known and unknown risks, uncertainties and other factors that are difficult to predict and which may cause future results, performance or achievements to differ. These risks, uncertainties and other factors include, among others: technological developments, alternative content offerings and their effects in our markets and on consumer behavior; competition for content, audiences, advertising and distribution in a swiftly consolidating industry; the public acceptance of our brands, programs, films and other entertainment content on the various platforms on which they are distributed; the impact on our advertising revenues of declines in linear television viewing, deficiencies in audience measurement and advertising market conditions; the potential for loss of carriage or other reduction in the distribution of our content; evolving cybersecurity and similar risks; the failure, destruction or breach of our critical satellites or facilities; content theft; increased costs for programming, films and other rights; the loss of key talent; domestic and global political, economic and/or regulatory factors affecting our businesses generally; volatility in capital markets or a decrease in our debt ratings; a potential inability to realize the anticipated goals underlying our ongoing investments in new businesses, products, services and technologies; fluctuations in our results due to the timing, mix, number and availability of our films and other programming; potential conflicts of interest arising from our ownership structure with a controlling stockholder; the pending merger may not be completed on anticipated terms and timing; a condition to closing of the pending merger may not be satisfied; the anticipated tax treatment of the pending merger may not be obtained; the potential impact of unforeseen liabilities, future capital expenditures, revenues, costs, expenses, earnings, synergies, economic performance, indebtedness, financial condition and losses on the future prospects, business and management strategies for the management, expansion and growth of the combined business after the consummation of the pending merger; litigation relating to the pending merger against
Important Information About The Pending Merger Between CBS and
In connection with the pending merger between
No Offer Or Solicitation
This news release is for informational purposes only and is not intended to and does not constitute an offer to subscribe for, buy or sell, or the solicitation of an offer to subscribe for, buy or sell, or an invitation to subscribe for, buy or sell any securities or a solicitation of any vote or approval in any jurisdiction, nor shall there be any sale, issuance or transfer of securities in any jurisdiction in which such offer, invitation, sale or solicitation would be unlawful prior to registration or qualification under the securities laws of any such jurisdiction. No offer of securities shall be made except by means of a prospectus meeting the requirements of Section 10 of the Securities Act of 1933, as amended, and otherwise in accordance with applicable law.
|
VIACOM INC. CONSOLIDATED STATEMENTS OF EARNINGS (Unaudited) |
|||||||||||||||
|
|
Quarter Ended |
|
Year Ended |
||||||||||||
|
(in millions, except per share amounts) |
2019 |
|
2018 |
|
2019 |
|
2018 |
||||||||
|
|
|
|
|
|
|
|
|
||||||||
|
Revenues |
$ |
3,433 |
|
|
$ |
3,485 |
|
|
$ |
12,838 |
|
|
$ |
12,943 |
|
|
Expenses: |
|
|
|
|
|
|
|
||||||||
|
Operating |
1,914 |
|
|
1,954 |
|
|
6,838 |
|
|
6,879 |
|
||||
|
Selling, general and administrative |
891 |
|
|
806 |
|
|
3,146 |
|
|
3,054 |
|
||||
|
Depreciation and amortization |
56 |
|
|
54 |
|
|
215 |
|
|
213 |
|
||||
|
Restructuring and other corporate matters |
42 |
|
|
25 |
|
|
177 |
|
|
225 |
|
||||
|
Total expenses |
2,903 |
|
|
2,839 |
|
|
10,376 |
|
|
10,371 |
|
||||
|
Operating income |
530 |
|
|
646 |
|
|
2,462 |
|
|
2,572 |
|
||||
|
Interest expense, net |
(125 |
) |
|
(132 |
) |
|
(489 |
) |
|
(560 |
) |
||||
|
Equity in net earnings of investee companies |
9 |
|
|
4 |
|
|
10 |
|
|
9 |
|
||||
|
Other items, net |
(2 |
) |
|
(8 |
) |
|
24 |
|
|
(24 |
) |
||||
|
Earnings from continuing operations before provision for income taxes |
412 |
|
|
510 |
|
|
2,007 |
|
|
1,997 |
|
||||
|
Provision for income taxes |
(93 |
) |
|
(111 |
) |
|
(445 |
) |
|
(269 |
) |
||||
|
Net earnings from continuing operations |
319 |
|
|
399 |
|
|
1,562 |
|
|
1,728 |
|
||||
|
Discontinued operations, net of tax |
4 |
|
|
8 |
|
|
26 |
|
|
31 |
|
||||
|
Net earnings (Viacom and noncontrolling interests) |
323 |
|
|
407 |
|
|
1,588 |
|
|
1,759 |
|
||||
|
Net earnings attributable to noncontrolling interests |
(16 |
) |
|
(13 |
) |
|
(40 |
) |
|
(40 |
) |
||||
|
Net earnings attributable to Viacom |
$ |
307 |
|
|
$ |
394 |
|
|
$ |
1,548 |
|
|
$ |
1,719 |
|
|
Amounts attributable to Viacom: |
|
|
|
|
|
|
|
||||||||
|
Net earnings from continuing operations |
$ |
303 |
|
|
$ |
386 |
|
|
$ |
1,522 |
|
|
$ |
1,688 |
|
|
Discontinued operations, net of tax |
4 |
|
|
8 |
|
|
26 |
|
|
31 |
|
||||
|
Net earnings attributable to Viacom |
$ |
307 |
|
|
$ |
394 |
|
|
$ |
1,548 |
|
|
$ |
1,719 |
|
|
Basic earnings per share attributable to Viacom: |
|
|
|
|
|
|
|
||||||||
|
Continuing operations |
$ |
0.75 |
|
|
$ |
0.96 |
|
|
$ |
3.77 |
|
|
$ |
4.19 |
|
|
Discontinued operations |
0.01 |
|
|
0.02 |
|
|
0.07 |
|
|
0.08 |
|
||||
|
Net earnings |
$ |
0.76 |
|
|
$ |
0.98 |
|
|
$ |
3.84 |
|
|
$ |
4.27 |
|
|
Diluted earnings per share attributable to Viacom: |
|
|
|
|
|
|
|
||||||||
|
Continuing operations |
$ |
0.75 |
|
|
$ |
0.96 |
|
|
$ |
3.77 |
|
|
$ |
4.19 |
|
|
Discontinued operations |
0.01 |
|
|
0.02 |
|
|
0.06 |
|
|
0.08 |
|
||||
|
Net earnings |
$ |
0.76 |
|
|
$ |
0.98 |
|
|
$ |
3.83 |
|
|
$ |
4.27 |
|
|
Weighted average number of common shares outstanding: |
|
|
|
|
|
|
|
||||||||
|
Basic |
403.7 |
|
|
403.1 |
|
|
403.4 |
|
|
402.7 |
|
||||
|
Diluted |
403.9 |
|
|
403.3 |
|
|
403.8 |
|
|
403.0 |
|
||||
|
|
|
|
|
|
|
|
|
||||||||
|
|
|
|
|
|
|
|
|
||||||||
|
VIACOM INC. CONSOLIDATED BALANCE SHEETS (Unaudited) |
|||||||
|
(in millions, except par value) |
September 30, |
|
September 30, |
||||
|
|
|
||||||
|
|
|
|
|
||||
|
ASSETS |
|
|
|
||||
|
Current assets: |
|
|
|
||||
|
Cash and cash equivalents |
$ |
760 |
|
|
$ |
1,557 |
|
|
Receivables, net |
3,299 |
|
|
3,141 |
|
||
|
Inventory, net |
775 |
|
|
896 |
|
||
|
Prepaid and other assets |
460 |
|
|
482 |
|
||
|
Total current assets |
5,294 |
|
|
6,076 |
|
||
|
Property and equipment, net |
922 |
|
|
919 |
|
||
|
Inventory, net |
4,023 |
|
|
3,848 |
|
||
|
Goodwill |
11,857 |
|
|
11,609 |
|
||
|
Intangibles, net |
354 |
|
|
313 |
|
||
|
Other assets |
1,221 |
|
|
1,018 |
|
||
|
Total assets |
$ |
23,671 |
|
|
$ |
23,783 |
|
|
|
|
|
|
||||
|
LIABILITIES AND EQUITY |
|
|
|
||||
|
Current liabilities: |
|
|
|
||||
|
Accounts payable |
$ |
482 |
|
|
$ |
433 |
|
|
Accrued expenses |
927 |
|
|
848 |
|
||
|
Participants’ share and residuals |
740 |
|
|
719 |
|
||
|
Program obligations |
667 |
|
|
662 |
|
||
|
Deferred revenue |
438 |
|
|
398 |
|
||
|
Current portion of debt |
98 |
|
|
567 |
|
||
|
Other liabilities |
472 |
|
|
427 |
|
||
|
Total current liabilities |
3,824 |
|
|
4,054 |
|
||
|
Noncurrent portion of debt |
8,640 |
|
|
9,515 |
|
||
|
Participants’ share and residuals |
492 |
|
|
523 |
|
||
|
Program obligations |
297 |
|
|
498 |
|
||
|
Deferred tax liabilities, net |
265 |
|
|
296 |
|
||
|
Other liabilities |
1,392 |
|
|
1,186 |
|
||
|
Redeemable noncontrolling interest |
241 |
|
|
246 |
|
||
|
Commitments and contingencies |
|
|
|
||||
|
Viacom stockholders’ equity: |
|
|
|
||||
|
Class A common stock, par value $0.001, 375.0 authorized; 49.4 and 49.4 outstanding, respectively |
— |
|
|
— |
|
||
|
Class B common stock, par value $0.001, 5,000.0 authorized; 354.3 and 353.7 outstanding, respectively |
— |
|
|
— |
|
||
|
Additional paid-in capital |
10,181 |
|
|
10,145 |
|
||
|
Treasury stock, 392.5 and 393.1 common shares held in treasury, respectively |
(20,541 |
) |
|
(20,562 |
) |
||
|
Retained earnings |
19,887 |
|
|
18,561 |
|
||
|
Accumulated other comprehensive loss |
(1,073 |
) |
|
(737 |
) |
||
|
Total Viacom stockholders’ equity |
8,454 |
|
|
7,407 |
|
||
|
Noncontrolling interests |
66 |
|
|
58 |
|
||
|
Total equity |
8,520 |
|
|
7,465 |
|
||
|
Total liabilities and equity |
$ |
23,671 |
|
|
$ |
23,783 |
|
|
|
|
|
|
||||
|
VIACOM INC. |
|||||||
|
CONSOLIDATED STATEMENTS OF CASH FLOWS |
|||||||
|
(Unaudited) |
|||||||
|
|
Year Ended |
||||||
|
(in millions) |
2019 |
|
2018 |
||||
|
OPERATING ACTIVITIES |
|
|
|
||||
|
Net earnings (Viacom and noncontrolling interests) |
$ |
1,588 |
|
|
$ |
1,759 |
|
|
Discontinued operations, net of tax |
(26 |
) |
|
(31 |
) |
||
|
Net earnings from continuing operations |
1,562 |
|
|
1,728 |
|
||
|
Reconciling items: |
|
|
|
||||
|
Depreciation and amortization |
215 |
|
|
213 |
|
||
|
Feature film and program amortization |
4,539 |
|
|
4,785 |
|
||
|
Equity-based compensation |
64 |
|
|
57 |
|
||
|
Gain on marketable securities |
(32 |
) |
|
— |
|
||
|
Gain on asset sales |
— |
|
|
(16 |
) |
||
|
Deferred income taxes |
40 |
|
|
(45 |
) |
||
|
Operating assets and liabilities, net of acquisitions: |
|
|
|
||||
|
Receivables |
(196 |
) |
|
(250 |
) |
||
|
Production and programming |
(4,664 |
) |
|
(4,606 |
) |
||
|
Accounts payable and other current liabilities |
120 |
|
|
(45 |
) |
||
|
Other, net |
(72 |
) |
|
1 |
|
||
|
Net cash provided by operating activities |
1,576 |
|
|
1,822 |
|
||
|
|
|
|
|
||||
|
INVESTING ACTIVITIES |
|
|
|
||||
|
Acquisitions and investments, net |
(424 |
) |
|
(112 |
) |
||
|
Capital expenditures |
(194 |
) |
|
(178 |
) |
||
|
Proceeds received from asset sales |
5 |
|
|
57 |
|
||
|
Grantor trust proceeds |
5 |
|
|
9 |
|
||
|
Net cash used in investing activities |
(608 |
) |
|
(224 |
) |
||
|
|
|
|
|
||||
|
FINANCING ACTIVITIES |
|
|
|
||||
|
Debt repayments |
(1,320 |
) |
|
(1,000 |
) |
||
|
Dividends paid |
(322 |
) |
|
(322 |
) |
||
|
Exercise of stock options |
— |
|
|
2 |
|
||
|
Other, net |
(102 |
) |
|
(90 |
) |
||
|
Net cash used in financing activities |
(1,744 |
) |
|
(1,410 |
) |
||
|
Effect of exchange rate changes on cash and cash equivalents |
(21 |
) |
|
(20 |
) |
||
|
Net change in cash and cash equivalents |
(797 |
) |
|
168 |
|
||
|
Cash and cash equivalents at beginning of period |
1,557 |
|
|
1,389 |
|
||
|
Cash and cash equivalents at end of period |
$ |
760 |
|
|
$ |
1,557 |
|
|
|
|
|
|
||||
SUPPLEMENTAL DISCLOSURES REGARDING NON-GAAP FINANCIAL MEASURES
We utilize certain financial measures that are not in accordance with accounting principles generally accepted in
We also utilize free cash flow, which is a non-GAAP financial measure, because we believe the use of this measure provides investors with an important perspective on our liquidity, including our ability to service debt and make investments in our business.
In addition, because foreign currency headwinds can be significant and unpredictable and are outside of our control, we provide certain financial information on a constant currency basis, excluding the impact of currency fluctuations, in order to provide a clearer view of our operating performance. This information compares results between periods as if exchange rates had remained constant period-over-period. We calculate this information by converting current-period local currency results using prior-year period average foreign currency exchange rates.
We believe that each of these adjusted measures provides relevant and useful information for investors because they clarify our actual operating performance, make it easier to compare our results with those of other companies, facilitate period-to-period comparisons of our business performance and allow investors to review performance in the same way as our management. Since these are not measures of performance calculated in accordance with GAAP, they should not be considered in isolation of, or as a substitute for, operating income, earnings from continuing operations before provision for income taxes, provision for income taxes, net earnings from continuing operations attributable to
The following tables reconcile our results of operations reported in accordance with GAAP for the quarters and years ended
|
(in millions, except per share amounts) |
|||||||||||||||||||
|
|
Quarter Ended |
||||||||||||||||||
|
|
Operating Income |
|
Earnings from |
|
Provision for |
|
Net Earnings from |
|
Diluted EPS from |
||||||||||
|
Reported results (GAAP) |
$ |
530 |
|
|
$ |
412 |
|
|
$ |
93 |
|
|
$ |
303 |
|
|
$ |
0.75 |
|
|
Factors Affecting Comparability: |
|
|
|
|
|
|
|
|
|
||||||||||
|
Restructuring and other corporate matters (2) |
42 |
|
|
42 |
|
|
1 |
|
|
41 |
|
|
0.10 |
|
|||||
|
Gain on marketable securities (3) |
— |
|
|
(11 |
) |
|
(3 |
) |
|
(8 |
) |
|
(0.02 |
) |
|||||
|
Discrete tax benefit (4) |
— |
|
|
— |
|
|
15 |
|
|
(15 |
) |
|
(0.04 |
) |
|||||
|
Adjusted results (Non-GAAP) |
$ |
572 |
|
|
$ |
443 |
|
|
$ |
106 |
|
|
$ |
321 |
|
|
$ |
0.79 |
|
|
|
|
|
|
|
|
|
|
|
|
||||||||||
|
(in millions, except per share amounts) |
|||||||||||||||||||
|
|
Year Ended |
||||||||||||||||||
|
|
Operating Income |
|
Earnings from |
|
Provision for |
|
Net Earnings from |
|
Diluted EPS from |
||||||||||
|
Reported results (GAAP) |
$ |
2,462 |
|
|
$ |
2,007 |
|
|
$ |
445 |
|
|
$ |
1,522 |
|
|
$ |
3.77 |
|
|
Factors Affecting Comparability: |
|
|
|
|
|
|
|
|
|
||||||||||
|
Restructuring and other corporate matters (2) |
177 |
|
|
177 |
|
|
32 |
|
|
145 |
|
|
0.36 |
|
|||||
|
Programming charges (5) |
77 |
|
|
77 |
|
|
18 |
|
|
59 |
|
|
0.14 |
|
|||||
|
Gain on extinguishment of debt (6) |
— |
|
|
(18 |
) |
|
(4 |
) |
|
(14 |
) |
|
(0.03 |
) |
|||||
|
Gain on marketable securities (3) |
— |
|
|
(32 |
) |
|
(8 |
) |
|
(24 |
) |
|
(0.06 |
) |
|||||
|
Discrete tax benefit (4) |
— |
|
|
— |
|
|
47 |
|
|
(47 |
) |
|
(0.12 |
) |
|||||
|
Adjusted results (Non-GAAP) |
$ |
2,716 |
|
|
$ |
2,211 |
|
|
$ |
530 |
|
|
$ |
1,641 |
|
|
$ |
4.06 |
|
|
|
|
|
|
|
|
|
|
|
|
||||||||||
|
(in millions, except per share amounts) |
|||||||||||||||||||
|
|
Quarter Ended |
||||||||||||||||||
|
|
Operating Income |
|
Earnings from |
|
Provision for |
|
Net Earnings |
|
Diluted EPS from |
||||||||||
|
Reported results (GAAP) |
$ |
646 |
|
|
$ |
510 |
|
|
$ |
111 |
|
|
$ |
386 |
|
|
$ |
0.96 |
|
|
Factors Affecting Comparability: |
|
|
|
|
|
|
|
|
|
||||||||||
|
Restructuring and other corporate matters(2) |
25 |
|
|
25 |
|
|
7 |
|
|
18 |
|
|
0.05 |
|
|||||
|
Discrete tax benefit (4)
|
— |
|
|
— |
|
|
4 |
|
|
(4 |
) |
|
(0.02 |
) |
|||||
|
Adjusted results (Non-GAAP) |
$ |
671 |
|
|
$ |
535 |
|
|
$ |
122 |
|
|
$ |
400 |
|
|
$ |
0.99 |
|
|
|
|
|
|
|
|
|
|
|
|
||||||||||
|
(in millions, except per share amounts) |
|||||||||||||||||||
|
|
Year Ended |
||||||||||||||||||
|
|
Operating Income |
|
Earnings from |
|
Provision for |
|
Net Earnings from |
|
Diluted EPS from |
||||||||||
|
Reported results (GAAP) |
$ |
2,572 |
|
|
$ |
1,997 |
|
|
$ |
269 |
|
|
$ |
1,688 |
|
|
$ |
4.19 |
|
|
Factors Affecting Comparability: |
|
|
|
|
|
|
|
|
|
||||||||||
|
Restructuring and other corporate matters(2) |
225 |
|
|
225 |
|
|
55 |
|
|
170 |
|
|
0.42 |
|
|||||
|
Gain on asset sale (7) |
— |
|
|
(16 |
) |
|
— |
|
|
(16 |
) |
|
(0.04 |
) |
|||||
|
Gain on extinguishment of debt (6) |
— |
|
|
(25 |
) |
|
(6 |
) |
|
(19 |
) |
|
(0.05 |
) |
|||||
|
Investment impairment (8) |
— |
|
|
46 |
|
|
10 |
|
|
36 |
|
|
0.09 |
|
|||||
|
Discrete tax benefit (4) |
— |
|
|
— |
|
|
200 |
|
|
(200 |
) |
|
(0.49 |
) |
|||||
|
Adjusted results (Non-GAAP) |
$ |
2,797 |
|
|
$ |
2,227 |
|
|
$ |
528 |
|
|
$ |
1,659 |
|
|
$ |
4.12 |
|
|
|
|
|
|
|
|
|
|
|
|
||||||||||
(1) The tax impact has been calculated by applying the tax rates applicable to the adjustments presented.
(2) In the quarter and year ended
We recognized restructuring costs of
(3) Pursuant to our adoption of Accounting Standards Update 2016-01 - Financial Instruments - Overall: Recognition and Measurement of Financial Assets and Financial Liabilities, which requires the changes in fair value measurement of marketable securities to be recognized in the Consolidated Statements of Earnings, we recorded a non-operating gain on marketable securities of
(4) The net discrete tax benefit in the quarter ended
The net discrete tax benefit in the quarter ended
(5) In the year ended
(6) In the years ended
(7) We completed the sale of a 1% equity interest in Viacom18 to our joint venture partner for
(8) We recognized a
The following table reconciles our net cash provided by operating activities (GAAP) for the Year Ended months ended
|
Reconciliation of net cash provided by operating activities |
Quarter Ended |
|
Better/ |
|
Year Ended |
|
Better/ |
||||||||||||||||
|
2019 |
|
2018 |
|
$ |
|
2019 |
|
2018 |
|
$ |
|||||||||||||
|
Net cash provided by operating activities (GAAP) |
$ |
473 |
|
|
$ |
825 |
|
|
$ |
(352 |
) |
|
$ |
1,576 |
|
|
$ |
1,822 |
|
|
$ |
(246 |
) |
|
Capital expenditures |
(75 |
) |
|
(76 |
) |
|
1 |
|
|
(194 |
) |
|
(178 |
) |
|
(16 |
) |
||||||
|
Free cash flow (Non-GAAP) |
$ |
398 |
|
|
$ |
749 |
|
|
$ |
(351 |
) |
|
$ |
1,382 |
|
|
$ |
1,644 |
|
|
$ |
(262 |
) |
|
|
|
|
|
|
|
|
|
|
|
|
|
||||||||||||
View source version on businesswire.com: https://www.businesswire.com/news/home/20191114005222/en/
Source:
Press:
Justin Dini
Senior Vice President, Corporate Communications
(212) 846-2724
justin.dini@viacom.com
Justin Blaber
Senior Director, Corporate Communications
(212) 846-3139
justin.blaber@viacom.com
Pranita Sookai
Director, Corporate Communications
(212) 846-7553
pranita.sookai@viacom.com
Investors:
James Bombassei
Senior Vice President, Investor Relations and Treasurer
(212) 258-6377
james.bombassei@viacom.com
Jaime Morris
Vice President, Investor Relations
(212) 846-5237
jaime.morris@viacom.com