UNITED STATES
SECURITIES AND EXCHANGE COMMISSION
Washington, D.C. 20549
FORM
CURRENT REPORT
Pursuant to Section 13 or 15(d)
of the Securities Exchange Act of 1934
Date of Report (Date of earliest event reported):
(Exact name of registrant as specified in its charter)
| (State or other jurisdiction of incorporation) |
(Commission File Number) |
(IRS Employer Identification Number) |
| (Address of principal executive offices) | (Zip Code) |
Registrant’s telephone number, including area code:
Not Applicable
(Former name or former address, if changed since last report)
Check the appropriate box below if the Form 8-K filing is intended to simultaneously satisfy the filing obligation of the registrant under any of the following provisions:
| Written communications pursuant to Rule 425 under the Securities Act (17 CFR 230.425) |
| Soliciting material pursuant to Rule 14a-12 under the Exchange Act (17 CFR 240.14a-12) |
| Pre-commencement communications pursuant to Rule 14d-2(b) under the Exchange Act (17 CFR 240.14d-2(b)) |
| Pre-commencement communications pursuant to Rule 13e-4(c) under the Exchange Act (17 CFR 240.13e-4(c)) |
Securities registered pursuant to Section 12(b) of the Act:
| Title of each class |
Trading Symbols |
Name of each exchange on which registered | ||
Indicate by check mark whether the registrant is an emerging growth company as defined in Rule 405 of the Securities Act of 1933 (§230.405 of this chapter) or Rule 12b-2 of the Securities Exchange Act of 1934 (§240.12b-2 of this chapter).
Emerging growth company
If an emerging growth company, indicate by check mark if the registrant has elected not to use the extended transition period for complying with any new or revised financial accounting standards provided pursuant to Section 13(a) of the Exchange Act. ☐
| Item 2.02 | Results of Operations and Financial Condition. |
On August 4, 2022, Paramount Global issued a press release announcing earnings for the second quarter ended June 30, 2022. A copy of the press release is furnished herewith as Exhibit 99 and is incorporated by reference herein in its entirety.
The information furnished pursuant to this Item 2.02, including Exhibit 99, shall not be deemed “filed” for purposes of Section 18 of the Securities Exchange Act of 1934, as amended (the “Exchange Act”), or otherwise subject to the liabilities under that Section and shall not be deemed to be incorporated by reference into any filings under the Securities Act of 1933, as amended, or the Exchange Act.
| Item 9.01 | Financial Statements and Exhibits. |
(d) Exhibits.
| Exhibit |
Description of Exhibit | |
| 99 | Press release of Paramount Global dated August 4, 2022, announcing earnings for the second quarter ended June 30, 2022. | |
| 104 | Cover Page Interactive Data File (embedded within the Inline XBRL document). | |
SIGNATURE
Pursuant to the requirements of the Securities Exchange Act of 1934, as amended, the registrant has duly caused this report to be signed on its behalf by the undersigned hereunto duly authorized.
| PARAMOUNT GLOBAL | ||
| By: | /s/ Christa A. D’Alimonte | |
| Name: | Christa A. D’Alimonte | |
| Title: | Executive Vice President, General Counsel and Secretary | |
Date: August 4, 2022
Exhibit 99

EARNINGS PRESS RELEASE | August 4, 2022 PARAMOUNT REPORTS Q2 2022 EARNINGS RESULTS « Strength in Filmed Entertainment and Strong Direct-to-Consumer (DTC) Growth Propels 19% Rise in Total Company Revenue « Paramount+ and Pluto TV Continue to Drive Subscriber and User Momentum – Total Global DTC Subscribers Rose to Nearly 64M, which Reflects the Removal of 3.9M Russia Subscribers – Paramount+ Added 4.9M Subscribers and Revenue Grew 120% – Expanded Pluto TV Global Monthly Active Users (MAUs) to Nearly 70M, Extending its Lead as the #1 Free Ad-Supported Streaming TV Service in the U.S. « Top Gun: Maverick Powered 126% Growth in Filmed Entertainment Revenue – Surpassed Titanic to Become the Biggest Paramount Domestic Movie of All Time – Five Paramount Pictures Movies Debuted #1 at the Box Office in the First Half of 2022 STATEMENT FROM BOB BAKISH, PRESIDENT & CEO Paramount continues to build momentum with the assets, strategy and ability to compete—and win. In Q2, we grew total company revenue by 19 percent and took market share in streaming, in broadcast TV, in box office and in upfront dollars, all while increasing our penetration of the most important growth market in media—streaming. At the heart of that growth was our hugely popular content—from the cultural phenomenon and #1 movie in the world, Top Gun: Maverick, to the most popular show in the country, Yellowstone. Our deep and growing library of valuable IP, coupled with the strength of our best-in-class assets, ensures we are well-positioned to continue to maximize value for our shareholders. $ IN MILLIONS, EXCEPT PER SHARE AMOUNTS Three Months Ended June 30 Six Months Ended June 30 GAAP 2022 2021 B/(W)% 2022 2021 B/(W)% Revenue $ 7,779 $ 6,564 19 % $ 15,107 $ 13,976 8 % TV Media 5,256 5,219 1 % 10,901 11,212 (3)% Direct-to-Consumer 1,193 767 56 % 2,282 1,365 67 % Filmed Entertainment 1,363 603 126 % 1,987 1,463 36 % Eliminations (33) (25) (32)% (63) (64) 2 % Operating income $ 819 $ 1,226 (33)% $ 1,594 $ 2,754 (42)% Diluted EPS from continuing operations attributable to Paramount $ .53 $ 1.50 (65)% $ 1.11 $ 2.93 (62)% Non-GAAP† Adjusted OIBDA $ 963 $ 1,240 (22)% $ 1,876 $ 2,867 (35)% Adjusted diluted EPS from continuing operations attributable to Paramount $ .64 $ .97 (34)% $ 1.24 $ 2.47 (50)% † Non-GAAP measures are detailed in the Supplemental Disclosures at the end of this release. *During 4Q20, Paramount entered into an agreement to sell Simon & Schuster. Simon & Schuster has been presented as a discontinued operation in the company’s consolidated financial statements for all periods.

Q2 2022 EARNINGS – SEGMENTS DIRECT-TO-CONSUMER Q2 HIGHLIGHTS • Global DTC subscribers rose to nearly 64M. – Reflects the addition of 5.2M subscribers and the removal of 3.9M Russia subscribers. – Paramount+ subscribers grew to over 43M, which reflects the addition of 4.9M subscribers and the removal of 1.2M Russia subscribers. • Paramount+ captured the most sign-ups, gross and net subscriber additions of any premium domestic streaming service in the quarter according to Antenna’s June 2022 Report. • Paramount+ subscriber growth was partially driven by successful international market launches, including the UK, Ireland and South Korea. • Paramount+’s broad content strategy continued to draw audiences in the quarter, including highly anticipated original series, movies, and sports. – Paramount+ saw strong acquisition and engagement from a variety of content led by Halo, 1883, The Lost City, Sonic the Hedgehog 2, Jackass Forever, Star Trek: Strange New Worlds, and the UEFA Champions League. – Both domestic and international hours watched per household demonstrated strong growth year-over-year. • Pluto TV grew global Monthly Active Users (MAUs) to nearly 70M, continuing its lead as the #1 free ad-supported streaming TV service in the U.S. – Grew total global viewing hours by double digits year-over-year for the second consecutive quarter. – Expanded international presence, launching in the Nordics in partnership with Viaplay Group and announced partnership with Corus in Canada, which will launch later this year. Q2 FINANCIALS • DTC revenue increased 56% year-over-year. – Subscription revenue grew 74% year-over-year to $830M, principally reflecting paid subscriber growth on Paramount+. – Advertising revenue rose 25% year-over-year, reflecting growth from Paramount+ and Pluto TV, driven by increased impressions on both services. – Paramount+ revenue grew 120%. • Adjusted OIBDA decreased $302M year-over-year, reflecting increased investment in our DTC services. $ IN MILLIONS Three Months Ended June 30 Six Months Ended June 30 2022 2021 $ B/(W) % 2022 2021 $ B/(W) % Revenue $ 1,193 $ 767 $ 426 56 % $ 2,282 $ 1,365 $ 917 67 % â–ª Advertising 363 291 72 25 710 509 201 39 â–ª Subscription 830 476 354 74 1,572 856 716 84 Expenses 1,638 910 (728) (80) 3,183 1,657 (1,526) (92) Adjusted OIBDA $ (445) $ (143) $ (302) (211)% $ (901) $ (292) $ (609) (209)% 2

Q2 2022 EARNINGS – SEGMENTS TV MEDIA Q2 HIGHLIGHTS • In Q2, Paramount’s family of networks delivered the #1 U.S. Share of View among audiences P2-11 and P12-17. – CBS was the most watched broadcast network for the 20th consecutive second quarter. The Network dominated the quarter with: • The top three most-watched programs: NCIS, FBI and Blue Bloods. • 7 of the quarter’s top 10 shows, as well as 18 of the top 30, more than all other networks combined. • The top comedies, including Young Sheldon and Ghosts, both ranked within the top 10 programs overall. – Paramount’s key domestic cable networks grew share year-over-year: • 11 of 19 cable networks either maintained or grew share, including Comedy Central and Nickelodeon. • Nickelodeon’s portfolio delivered its highest year-over-year share growth since Q2 2017. FBI NCIS • Nickelodeon was the #1 network in key kids demographics: K2-11 for the 28th consecutive quarter; K6-11 for the 23rd consecutive quarter. Q2 FINANCIALS • Revenue rose 1% year-over-year, reflecting growth in content licensing revenues, partially offset by lower advertising and affiliate revenues. – Advertising revenue decreased 6% year-over-year, as pricing only partially offset the impact of lower linear impressions and FX. – Affiliate and subscription revenue declined 3% year-over-year, driven by lower revenues in international markets, where we restructured key affiliate agreements, resulting in a shift of revenue from our pay television services to our DTC services. – Licensing and other revenues grew 27% year-over-year. • Adjusted OIBDA decreased 8% year-over-year, primarily driven by the lower advertising and affiliate revenues. Source: Nielsen Media Research $ IN MILLIONS Three Months Ended June 30 Six Months Ended June 30 2022 2021 $ B/(W) % 2022 2021 $ B/(W) % Revenue $ 5,256 $ 5,219 $ 37 1 % $ 10,901 $ 11,212 $ (311) (3)% Advertising 2,174 2,303 (129) (6) 4,695 5,191 (496) (10) Affiliate and subscription 2,058 2,112 (54) (3) 4,156 4,195 (39) (1) Licensing and other 1,024 804 220 27 2,050 1,826 224 12 Expenses 3,876 3,715 (161) (4) 7,977 7,943 (34) — Adjusted OIBDA $ 1,380 $ 1,504 $ (124) (8)% $ 2,924 $ 3,269 $ (345) (11)% 3
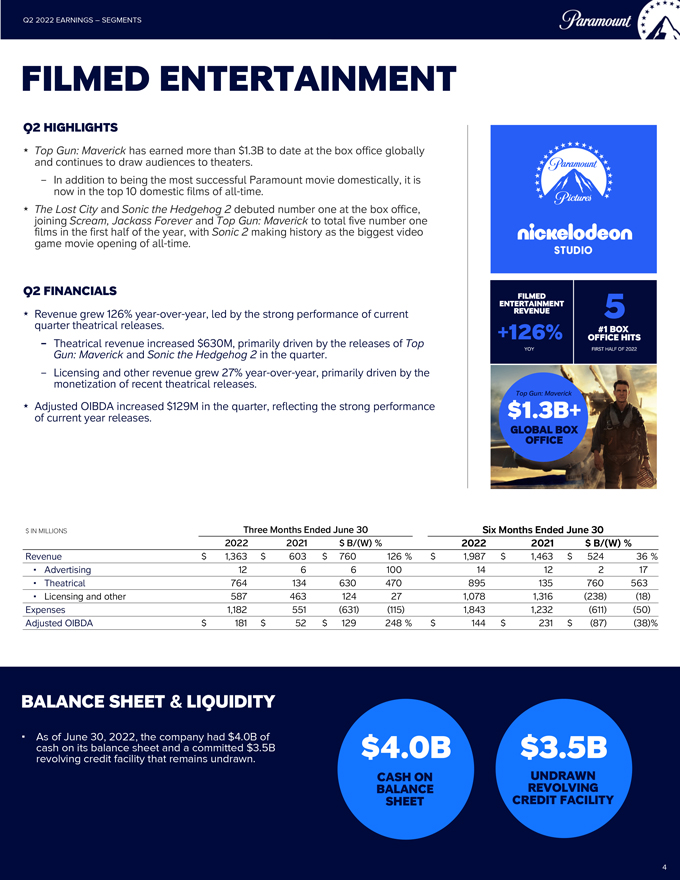
Q2 2022 EARNINGS – SEGMENTS FILMED ENTERTAINMENT Q2 HIGHLIGHTS • Top Gun: Maverick has earned more than $1.3B to date at the box office globally and continues to draw audiences to theaters. – In addition to being the most successful Paramount movie domestically, it is now in the top 10 domestic films of all-time. • The Lost City and Sonic the Hedgehog 2 debuted number one at the box office, joining Scream, Jackass Forever and Top Gun: Maverick to total five number one films in the first half of the year, with Sonic 2 making history as the biggest video game movie opening of all-time. Q2 FINANCIALS • Revenue grew 126% year-over-year, led by the strong performance of current quarter theatrical releases. – Theatrical revenue increased $630M, primarily driven by the releases of Top Gun: Maverick and Sonic the Hedgehog 2 in the quarter. – Licensing and other revenue grew 27% year-over-year, primarily driven by the monetization of recent theatrical releases. Top Gun: Maverick • Adjusted OIBDA increased $129M in the quarter, reflecting the strong performance of current year releases. $ IN MILLIONS Three Months Ended June 30 Six Months Ended June 30 2022 2021 $ B/(W) % 2022 2021 $ B/(W) % Revenue $ 1,363 $ 603 $ 760 126 % $ 1,987 $ 1,463 $ 524 36 % â–ª Advertising 12 6 6 100 14 12 2 17 â–ª Theatrical 764 134 630 470 895 135 760 563 â–ª Licensing and other 587 463 124 27 1,078 1,316 (238) (18) Expenses 1,182 551 (631) (115) 1,843 1,232 (611) (50) Adjusted OIBDA $ 181 $ 52 $ 129 248 % $ 144 $ 231 $ (87) (38)% BALANCE SHEET & LIQUIDITY â–ª As of June 30, 2022, the company had $4.0B of cash on its balance sheet and a committed $3.5B $4.0B $3.5B revolving credit facility that remains undrawn. CASH ON UNDRAWN BALANCE REVOLVING SHEET CREDIT FACILITY 4

ABOUT PARAMOUNT Paramount (NASDAQ: PARA; PARAA) is a leading global media and entertainment company that creates premium content and experiences for audiences worldwide. Driven by iconic consumer brands, its portfolio includes CBS, Showtime Networks, Paramount Pictures, Nickelodeon, MTV, Comedy Central, BET, Paramount+, Pluto TV and Simon & Schuster, among others. The company delivers the largest share of the U.S. television audience and boasts one of the industry’s most important and extensive libraries of TV and film titles. In addition to offering innovative streaming services and digital video products, Paramount provides powerful capabilities in production, distribution and advertising solutions. For more information about Paramount, please visit www.paramount.com and follow @ParamountCo on social platforms. PARA-IR CAUTIONARY NOTE CONCERNING FORWARD-LOOKING STATEMENTS statements This communication that are not contains statements both historical of historical and fact forward-looking are, or may be statements, deemed to including be, forward-looking statements statements related to our within future the results meaning and of performance. the Private All These Securities forward-looking Litigation Reform statements Act of 1995. reflect Similarly, our current statements expectations that describe concerning our future objectives, results plans and or events; goals generally are or may can be be forward-looking identified by the statements. use of similar statements words that or include phrases; phrases and involve such known as “believe,” and unknown “expect,” risks, “anticipate,” uncertainties “intend,” and “plan,” other factors “foresee,” that “likely,” are difficult “will,” to “may,” predict “could,” and which “estimate” may cause or other our statements. actual results, These performance risks, uncertainties or achievements and other to be factors different include, from among any future others: results, risks performance related to our or streaming achievements initiatives; expressed changes or implied in consumer by these behavior, viewership, as well as evolving advertising technologies, market conditions distribution and platforms deficiencies and in packaging; audience measurement; the impact on our our ability advertising to maintain revenues attractive as a result brands of changes and our in reputation, consumer and to offer advertising popular and programming distribution; and the other potential content; for loss increased of carriage costs or for other content reduction and other in or the rights; impact competition of negotiations for talent, for content, the distribution audiences, of our subscribers, content; losses due businesses, to asset products, impairment services charges and for technologies, goodwill, intangible through assets, acquisitions FCC licenses and other and strategic programming; initiatives; risks evolving related business to our ongoing continuity, investments cybersecurity, in new privacy domestic and data protection and global and political, similar economic risks; content and regulatory infringement; factors the affecting impact of our COVID-19 businesses and other generally; pandemics liabilities and related measures to discontinued taken in response operations thereto; and former conflicts businesses; of interest the arising loss from of existing our ownership or inability structure to hire with new akey controlling employees stockholder; or secure creative and other talent; factors strikes described and other in our union news activity; releases potential and filings with 8-K. the Securities There may and be Exchange additional Commission, risks, uncertainties including and but factors not limited that we to do our not most currently recent view Annual as material Report on or that Form are 10-K not and necessarily reports on known. Form The 10-Q forward- and Form looking publicly statements update any included forward-looking in this communication statements to reflect are made subsequent only as of events the date or circumstances. of this communication, and we do not undertake any obligation to 5

CONTACTS PRESS Justin Dini Executive Vice President Corporate Communications (212) 846-2724 justin.dini@paramount.com Peter Collins Vice President Corporate Communications (917) 826-4182 peter.collins@paramount.com INVESTORS Anthony DiClemente Executive Vice President Investor Relations (917) 796-4647 anthony.diclemente@paramount.com Jaime Morris Senior Vice President Investor Relations (646) 824-5450 jaime.morris@paramount.com Robert Amparo Director Investor Relations (347) 223-1682 robert.amparo@paramount.com

PARAMOUNT GLOBAL AND SUBSIDIARIES CONSOLIDATED STATEMENTS OF OPERATIONS (Unaudited; in millions, except per share amounts) Three Months Ended Six Months Ended June 30, June 30, 2022 2021 2022 2021 Revenues $ 7,779 $ 6,564 $ 15,107 $ 13,976 Costs and expenses: Operating 5,106 3,865 9,902 8,228 Selling, general and administrative 1,710 1,459 3,329 2,881 Depreciation and amortization 94 95 190 194 Restructuring and other corporate matters 50 35 107 35 Total costs and expenses 6,960 5,454 13,528 11,338 Net gain on sales — 116 15 116 Operating income 819 1,226 1,594 2,754 Interest expense (230) (243) (470) (502) Interest income 19 13 40 26 Net gains from investments — 32 — 52 Loss on extinguishment of debt (47) — (120) (128) Other items, net (42) (10) (55) (29) Earnings from continuing operations before income taxes and equity in loss of investee companies 519 1,018 989 2,173 (Provision) benefit for income taxes (129) 34 (163) (192) Equity in loss of investee companies, net of tax (29) (44) (66) (62) Net earnings from continuing operations 361 1,008 760 1,919 Net earnings from discontinued operations, net of tax 61 41 103 53 Net earnings (Paramount and noncontrolling interests) 422 1,049 863 1,972 Net earnings attributable to noncontrolling interests (3) (13) (11) (25) Net earnings attributable to Paramount $ 419 $ 1,036 $ 852 $ 1,947 Amounts attributable to Paramount: Net earnings from continuing operations $ 358 $ 995 $ 749 $ 1,894 Net earnings from discontinued operations, net of tax 61 41 103 53 Net earnings attributable to Paramount $ 419 $ 1,036 $ 852 $ 1,947 Basic net earnings per common share attributable to Paramount: Net earnings from continuing operations $ .53 $ 1.52 $ 1.11 $ 2.96 Net earnings from discontinued operations $ .09 $ .06 $ .16 $ .08 Net earnings $ .62 $ 1.58 $ 1.27 $ 3.05 Diluted net earnings per common share attributable to Paramount: Net earnings from continuing operations $ .53 $ 1.50 $ 1.11 $ 2.93 Net earnings from discontinued operations $ .09 $ .06 $ .16 $ .08 Net earnings $ .62 $ 1.56 $ 1.27 $ 3.01 Weighted average number of common shares outstanding: Basic 649 646 649 634 Diluted 650 662 650 647 (a) Diluted net earnings per common share (“EPS”) for the three and six months ended June 30, 2022, excludes the effect of the assumed conversion of our 5.75% Series A Mandatory Convertible Preferred Stock to shares of common stock since it would have been antidilutive. As a result, in the calculations of diluted EPS the weighted average number of diluted shares outstanding does not include the assumed issuance of shares upon conversion of preferred stock, and preferred stock dividends recorded during the three and six months ended June 30, 2022 of $14 million and $29 million, respectively, are deducted from net earnings from continuing operations and net earnings, as applicable.

PARAMOUNT GLOBAL AND SUBSIDIARIES CONSOLIDATED BALANCE SHEETS (Unaudited; in millions, except per share amounts) At At June 30, 2022 December 31, 2021 ASSETS Current Assets: Cash and cash equivalents $ 4,037 $ 6,267 Receivables, net 6,959 6,984 Programming and other inventory 1,347 1,504 Prepaid expenses and other current assets 1,223 1,176 Current assets of discontinued operations 616 745 Total current assets 14,182 16,676 Property and equipment, net 1,705 1,736 Programming and other inventory 14,308 13,358 Goodwill 16,498 16,584 Intangible assets, net 2,739 2,772 Operating lease assets 1,544 1,630 Deferred income tax assets, net 1,258 1,206 Other assets 3,906 3,824 Assets held for sale — 19 Assets of discontinued operations 821 815 Total Assets $ 56,961 $ 58,620 LIABILITIES AND STOCKHOLDERS’ EQUITY Current Liabilities: Accounts payable $ 853 $ 800 Accrued expenses 2,108 2,323 Participants’ share and royalties payable 2,466 2,159 Accrued programming and production costs 1,607 1,342 Deferred revenues 885 1,091 Debt 37 11 Other current liabilities 1,231 1,182 Current liabilities of discontinued operations 449 571 Total current liabilities 9,636 9,479 Long-term debt 15,773 17,698 Participants’ share and royalties payable 1,413 1,244 Pension and postretirement benefit obligations 1,879 1,946 Deferred income tax liabilities, net 1,040 1,063 Operating lease liabilities 1,514 1,598 Program rights obligations 430 404 Other liabilities 1,683 1,898 Liabilities of discontinued operations 205 213 Redeemable noncontrolling interest 108 107 Commitments and contingencies Paramount stockholders’ equity: 5.75% Series A Mandatory Convertible Preferred Stock, par value $.001 per share; 25 shares authorized and 10 shares issued (2022 and 2021) — — Class A Common Stock, par value $.001 per share; 55 shares authorized; 41 shares issued (2022 and 2021) — — Class B Common Stock, par value $.001 per share; 5,000 shares authorized; 1,111 (2022) and 1,110 (2021) shares issued 1 1 Additional paid-in capital 32,984 32,918 Treasury stock, at cost; 503 (2022 and 2021) Class B shares (22,958) (22,958) Retained earnings 14,829 14,343 Accumulated other comprehensive loss (2,080) (1,902) Total Paramount stockholders’ equity 22,776 22,402 Noncontrolling interests 504 568 Total Equity 23,280 22,970 Total Liabilities and Equity $ 56,961 $ 58,620

PARAMOUNT GLOBAL AND SUBSIDIARIES CONSOLIDATED STATEMENTS OF CASH FLOWS (Unaudited; in millions) Six Months Ended June 30, 2022 2021 Operating Activities: Net earnings (Paramount and noncontrolling interests) $ 863 $ 1,972 Less: Net earnings from discontinued operations, net of tax 103 53 Net earnings from continuing operations 760 1,919 Adjustments to reconcile net earnings from continuing operations to net cash flow provided by operating activities from continuing operations: Depreciation and amortization 190 194 Deferred tax benefit (56) (110) Stock-based compensation 77 101 Net gain on sales (15) (116) Gains from investments — (52) Loss on extinguishment of debt 120 128 Equity in loss of investee companies, net of tax 66 62 Change in assets and liabilities (667) (424) Net cash flow provided by operating activities from continuing operations 475 1,702 Net cash flow provided by operating activities from discontinued operations 116 89 Net cash flow provided by operating activities 591 1,791 Investing Activities: Investments (141) (114) Capital expenditures (151) (138) Proceeds from dispositions 36 408 Other investing activities (1) (25) Net cash flow (used for) provided by investing activities from continuing operations (257) 131 Net cash flow used for investing activities from discontinued operations (1) (2) Net cash flow (used for) provided by investing activities (258) 129 Financing Activities: Proceeds from issuance of debt 1,078 38 Repayment of debt (3,108) (2,200) Dividends paid on preferred stock (29) — Dividends paid on common stock (315) (302) Proceeds from issuance of preferred stock — 983 Proceeds from issuance of common stock — 1,672 Payment of payroll taxes in lieu of issuing shares for stock-based compensation (13) (49) Proceeds from exercise of stock options — 408 Payments to noncontrolling interests (77) (157) Other financing activities (34) (42) Net cash flow (used for) provided by financing activities (2,498) 351 Effect of exchange rate changes on cash and cash equivalents (65) (8) Net (decrease) increase in cash, cash equivalents and restricted cash (2,230) 2,263 Cash, cash equivalents and restricted cash at beginning of year (includes $135 (2021) of restricted cash) 6,267 3,119 Cash, cash equivalents and restricted cash at end of period (includes $7 (2021) of restricted cash) $ 4,037 $ 5,382

SUPPLEMENTAL DISCLOSURES REGARDING NON-GAAP FINANCIAL MEASURES (Unaudited; in millions, except per share amounts) Results for the three and six months ended June 30, 2022 and 2021 included certain items identified as affecting comparability. Adjusted operating income before depreciation and amortization (“Adjusted OIBDA”), adjusted earnings from continuing operations before income taxes, adjusted provision for income taxes, adjusted net earnings from continuing operations attributable to Paramount, and adjusted diluted EPS from continuing operations (together, the “adjusted measures”) exclude the impact of these items and are measures of performance not calculated in accordance with accounting principles generally accepted in the United States of America (“GAAP”). We use these measures to, among other things, evaluate our operating performance. These measures are among the primary measures used by management for planning and forecasting of future periods, and they are important indicators of our operational strength and business performance. In addition, we use Adjusted OIBDA to, among other things, value prospective acquisitions. We believe these measures are relevant and useful for investors because they allow investors to view performance in a manner similar to the method used by our management; provide a clearer perspective on our underlying performance; and make it easier for investors, analysts and peers to compare our operating performance to other companies in our industry and to compare our year-over-year results. Because the adjusted measures are measures of performance not calculated in accordance with GAAP, they should not be considered in isolation of, or as a substitute for, operating income, earnings from continuing operations before income taxes, provision/benefit for income taxes, net earnings from continuing operations attributable to Paramount or diluted EPS from continuing operations, as applicable, as indicators of operating performance. These measures, as we calculate them, may not be comparable to similarly titled measures employed by other companies. The following tables reconcile the adjusted measures to their most directly comparable financial measures in accordance with GAAP. Three Months Ended Six Months Ended June 30, June 30, 2022 2021 2022 2021 Operating income (GAAP) $ 819 $ 1,226 $ 1,594 $ 2,754 Depreciation and amortization 94 95 190 194 Restructuring and other corporate matters (a) 50 35 107 35 Net gain on sales (a) — (116) (15) (116) Adjusted OIBDA (Non-GAAP) $ 963 $ 1,240 $ 1,876 $ 2,867 (a) See notes on the following tables for additional information on items affecting comparability.

SUPPLEMENTAL DISCLOSURES REGARDING NON-GAAP FINANCIAL MEASURES (Continued) (Unaudited; in millions, except per share amounts) Three Months Ended June 30, 2022 Net Earnings Earnings from from Continuing Continuing Diluted EPS Operations Operations from Before Income Provision for Attributable to Continuing Taxes Income Taxes Paramount Operations Reported (GAAP) $ 519 $ (129) $ 358 $ .53 Items affecting comparability: Restructuring and other corporate matters (a) 50 (12) 38 .06 Loss on extinguishment of debt 47 (11) 36 .05 Discrete tax items — (3) (3) — Adjusted (Non-GAAP) $ 616 $ (155) $ 429 $ .64 (a) Reflects restructuring charges of $10 million consisting of severance costs primarily associated with changes in management related to the realignment of our operating segments, as well as a charge of $40 million associated with litigation described under Legal Matters—Stockholder Matters in our Quarterly Report on Form 10-Q for the quarter ended June 30, 2022. Three Months Ended June 30, 2021 Net Earnings Earnings from from Continuing Continuing Diluted EPS Operations (Provision) Operations from Before Income Benefit for Attributable to Continuing Taxes Income Taxes Paramount Operations Reported (GAAP) $ 1,018 $ 34 $ 995 $ 1.50 Items affecting comparability: Restructuring and other corporate matters (a) 35 (8) 27 .04 Net gain on sales (b) (116) 27 (89) (.13) Net gains from investments (c) (32) 7 (25) (.04) Discrete tax items (d) — (268) (268) (.40) Adjusted (Non-GAAP) $ 905 $ (208) $ 640 $ .97 (a) Reflects the impairment of lease assets in connection with cost transformation initiatives related to the merger of Viacom Inc. (“Viacom”) with and into CBS Corporation (“CBS”) (“the Merger”). (b) Primarily reflects a gain on the sale of a noncore trademark licensing operation. (c) Reflects a gain of $37 million on the sale of an investment, partially offset by a decrease in the fair value of a marketable security of $5 million. (d) Primarily reflects a benefit of $260 million to remeasure our UK net deferred income tax asset as a result of the enactment in June 2021 of an increase in the UK corporate income tax rate from 19% to 25% beginning April 1, 2023, as well as a net tax benefit in connection with the settlement of income tax audits.
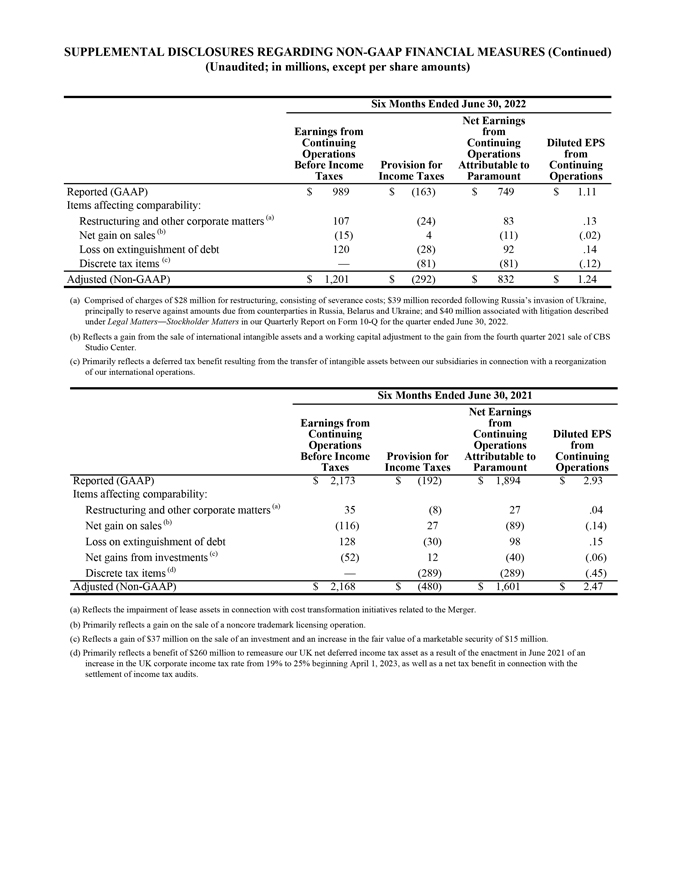
SUPPLEMENTAL DISCLOSURES REGARDING NON-GAAP FINANCIAL MEASURES (Continued) (Unaudited; in millions, except per share amounts) Six Months Ended June 30, 2022 Net Earnings Earnings from from Continuing Continuing Diluted EPS Operations Operations from Before Income Provision for Attributable to Continuing Taxes Income Taxes Paramount Operations Reported (GAAP) $ 989 $ (163) $ 749 $ 1.11 Items affecting comparability: Restructuring and other corporate matters (a) 107 (24) 83 .13 Net gain on sales (b) (15) 4 (11) (.02) Loss on extinguishment of debt 120 (28) 92 .14 Discrete tax items (c) — (81) (81) (.12) Adjusted (Non-GAAP) $ 1,201 $ (292) $ 832 $ 1.24 (a) Comprised of charges of $28 million for restructuring, consisting of severance costs; $39 million recorded following Russia’s invasion of Ukraine, principally to reserve against amounts due from counterparties in Russia, Belarus and Ukraine; and $40 million associated with litigation described under Legal Matters—Stockholder Matters in our Quarterly Report on Form 10-Q for the quarter ended June 30, 2022. (b) Reflects a gain from the sale of international intangible assets and a working capital adjustment to the gain from the fourth quarter 2021 sale of CBS Studio Center. (c) Primarily reflects a deferred tax benefit resulting from the transfer of intangible assets between our subsidiaries in connection with a reorganization of our international operations. Six Months Ended June 30, 2021 Net Earnings Earnings from from Continuing Continuing Diluted EPS Operations Operations from Before Income Provision for Attributable to Continuing Taxes Income Taxes Paramount Operations Reported (GAAP) $ 2,173 $ (192) $ 1,894 $ 2.93 Items affecting comparability: Restructuring and other corporate matters (a) 35 (8) 27 .04 Net gain on sales (b) (116) 27 (89) (.14) Loss on extinguishment of debt 128 (30) 98 .15 Net gains from investments (c) (52) 12 (40) (.06) Discrete tax items (d) — (289) (289) (.45) Adjusted (Non-GAAP) $ 2,168 $ (480) $ 1,601 $ 2.47 (a) Reflects the impairment of lease assets in connection with cost transformation initiatives related to the Merger. (b) Primarily reflects a gain on the sale of a noncore trademark licensing operation. (c) Reflects a gain of $37 million on the sale of an investment and an increase in the fair value of a marketable security of $15 million. (d) Primarily reflects a benefit of $260 million to remeasure our UK net deferred income tax asset as a result of the enactment in June 2021 of an increase in the UK corporate income tax rate from 19% to 25% beginning April 1, 2023, as well as a net tax benefit in connection with the settlement of income tax audits.