Viacom Reports Fourth Quarter and Full Year Growth
Company Continued to Deliver Improvements in Financial Performance as Strategic Plan Advances
Revenues Increased 6% in Full Year and 3% in Quarter, Due to Gains in
Produced Growth in Net Earnings and Diluted Earnings Per Share in Full Year and Fourth Quarter
Full Year Net Cash Provided by Operating Activities Increased 22% to
This press release features multimedia. View the full release here: http://www.businesswire.com/news/home/20171116005398/en/
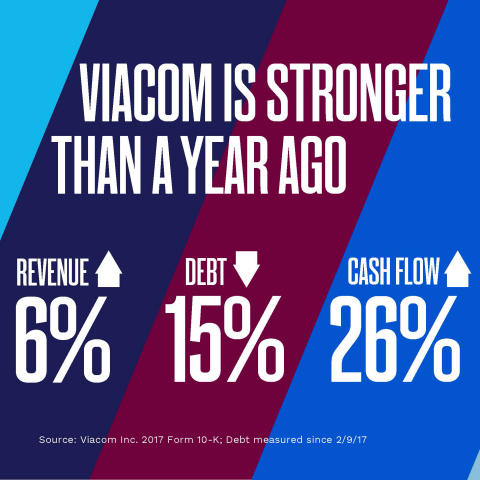
"Viacom is stronger and our momentum continues to build. To accelerate
our transition to long-term, sustainable growth, we are ramping up the
evolution of
|
FISCAL YEAR 2017 RESULTS |
|||||||||||||||||||||||||||||
| (in millions, except per share amounts) |
Quarter Ended |
B/(W) |
Year Ended |
B/(W) | |||||||||||||||||||||||||
| 2017 | 2016 |
2017 vs. |
2017 | 2016 |
2017 vs. |
||||||||||||||||||||||||
|
GAAP |
|||||||||||||||||||||||||||||
| Revenues | $ | 3,319 | $ | 3,226 | 3 | % | $ | 13,263 | $ | 12,488 | 6 | % | |||||||||||||||||
| Operating income | 705 | 332 | 112 | 2,489 | 2,526 | (1 | ) | ||||||||||||||||||||||
|
Net earnings from continuing operations attributable to |
674 | 252 | 167 | 1,871 | 1,436 | 30 | |||||||||||||||||||||||
| Diluted EPS from continuing operations | 1.67 | 0.63 | 165 | 4.67 | 3.61 | 29 | |||||||||||||||||||||||
|
Non-GAAP* |
|||||||||||||||||||||||||||||
| Adjusted operating income | $ | 578 | $ | 538 | 7 | % | $ | 2,743 | $ | 2,732 | — | ||||||||||||||||||
|
Adjusted net earnings from continuing operations attributable to
|
310 | 273 | 14 | 1,511 | 1,465 | 3 | |||||||||||||||||||||||
| Adjusted diluted EPS from continuing operations | 0.77 | 0.69 | 12 | 3.77 | 3.68 | 2 | |||||||||||||||||||||||
|
* Non-GAAP measures referenced in this release are detailed in the Supplemental Disclosures at the end of this release. |
|||||||||||||||||||||||||||||
Quarterly revenues increased 3% to
Full year revenues grew 6% to
MEDIA NETWORKS
Quarterly revenues increased 3% to
Advertising revenues were up 6% to
Affiliate revenues decreased 1% to
Ancillary revenues improved 5% to
Adjusted operating income for Media Networks declined 8% to
Full year revenues increased 2% to
Advertising revenues improved 1% to
Affiliate revenues increased 2% to
Ancillary revenues improved 3% to
Adjusted full year operating income decreased 5% to
Performance highlights:
-
Viacom had the #1 share of viewing on cable, with the #1 share for several diverse and coveted audiences including Kids 2-11, Millennials, African Americans, the Adults 18-49 advertising demo, as well as Adults 2-49 across all of TV. -
In the quarter, domestic Media Networks grew ratings 3% year-over-year
across its entire portfolio, with flagship networks up 6%
year-over-year and double-digit increases at
MTV andBET . This ratings improvement drove domestic advertising revenues, which stabilized in the quarter after three years of declines. -
In 2017,
Viacom successfully completed multi-year contract renewals with several major distributors, including Altice USA and Charter Communications, among others. We have now renewed or extended agreements for nearly half of our subscriber base in the last year, ensuring continued carriage of our networks while unlocking opportunities to deliver greater value through partnerships that leverage our advanced advertising and data capabilities. -
MTV achieved its first double-digit ratings increase in more than six years, driven by primetime viewership of new shows including Siesta Key - the #1 original cable series in its timeslot. Moving into fiscal 2018, the multiplatform reboot of TRL drove a 21% increase in total views ofMTV's digital and social content, while consistently ranking as a Top 10 Most Social Show across broadcast and cable. -
Anchored by signature scripted series including the #1 primetime cable
comedy of 2017 - South Park - and a rebuilt late-night slate
that now boasts TV's #1 late night talk show with millennials -
The Daily Show withTrevor Noah -Comedy Central continued its turnaround, growing ratings in its key demo for the first time since fiscal 2014. -
Viacom International Media Networks continued to deliver strong top-line growth, with year-over-year revenues up 24% and 12% in the quarter and full year, respectively. Ratings across the VIMN portfolio grew 4% in the quarter, driven by the strong performances ofParamount Channel,Comedy Central , Nickelodeon andChannel 5 .
FILMED ENTERTAINMENT
Quarterly revenues improved 2% to
Theatrical revenues decreased 43% to
Licensing revenues grew 30% to
Home entertainment revenues declined 5% to
Ancillary revenues grew 33% to
Full year revenues grew 24% to
Theatrical revenues increased 34% to
Licensing revenues grew 20% to
Home entertainment revenues improved 8% to
Ancillary revenues increased 82% to
Performance highlights:
-
Paramount Television continued its significant growth, more than
tripling its revenues in the fiscal year through breakout releases
including Shooter, 13 Reasons Why and
Berlin Station - all of which were renewed for second seasons. -
Paramount continued to execute on its strategic plan by rebuilding the slate, refining its management team and stabilizing costs. -
Notable feature film releases in the first quarter of fiscal 2018
include Daddy's Home 2, a follow-up to the successful 2015
release; and
Alexander Payne's Downsizing.
BALANCE SHEET AND LIQUIDITY
In the quarter, the Company continued to implement its plan to
strengthen its balance sheet, including executing on the sale of a
non-core asset. At
The Company's cash balance was
About
For more information about
Cautionary Statement Concerning Forward-Looking Statements
This news release contains both historical and forward-looking
statements. All statements that are not statements of historical fact
are, or may be deemed to be, forward-looking statements. Forward-looking
statements reflect our current expectations concerning future results,
objectives, plans and goals, and involve known and unknown risks,
uncertainties and other factors that are difficult to predict and which
may cause future results, performance or achievements to differ. These
risks, uncertainties and other factors include, among others: the public
acceptance of our brands, programs, motion pictures and other
entertainment content on the various platforms on which they are
distributed; technological developments, alternative content offerings
and their effects in our markets and on consumer behavior; the potential
for loss of carriage or other reduction in the distribution of our
content; significant changes in our senior leadership and the ability of
our recently-announced strategic initiatives to achieve their operating
objectives; economic fluctuations in advertising and retail markets, and
economic conditions generally; evolving cybersecurity and similar risks;
the impact of piracy; increased costs for programming, motion pictures
and other rights; the loss of key talent; competition for content,
audiences, advertising and distribution; fluctuations in our results due
to the timing, mix, number and availability of our motion pictures and
other programming; other domestic and global economic, political,
business, competitive and/or regulatory factors affecting our businesses
generally; changes in the Federal communications or other laws and
regulations; and other factors described in our news releases and
filings with the
|
|
|||||||||||||||||||||
|
CONSOLIDATED STATEMENTS OF EARNINGS |
|||||||||||||||||||||
|
(Unaudited) |
|||||||||||||||||||||
|
Quarter Ended |
Year Ended |
||||||||||||||||||||
| (in millions, except per share amounts) | 2017 | 2016 | 2017 | 2016 | |||||||||||||||||
| Revenues | $ | 3,319 | $ | 3,226 | $ | 13,263 | $ | 12,488 | |||||||||||||
| Expenses: | |||||||||||||||||||||
| Operating | 1,885 | 1,862 | 7,436 | 6,684 | |||||||||||||||||
| Selling, general and administrative | 800 | 771 | 3,005 | 2,851 | |||||||||||||||||
| Depreciation and amortization | 56 | 55 | 223 | 221 | |||||||||||||||||
| Restructuring | — | 206 | 237 | 206 | |||||||||||||||||
| Total expenses | 2,741 | 2,894 | 10,901 | 9,962 | |||||||||||||||||
| Gain on asset sale | 127 | — | 127 | — | |||||||||||||||||
| Operating income | 705 | 332 | 2,489 | 2,526 | |||||||||||||||||
| Interest expense, net | (149 | ) | (150 | ) | (618 | ) | (616 | ) | |||||||||||||
| Equity in net earnings of investee companies | 3 | 2 | 81 | 87 | |||||||||||||||||
|
Gain on sale of |
— | — | 285 | — | |||||||||||||||||
| Other items, net | 12 | (6 | ) | (25 | ) | (7 | ) | ||||||||||||||
| Earnings from continuing operations before provision for income taxes | 571 | 178 | 2,212 | 1,990 | |||||||||||||||||
| Provision for income taxes | 124 | 83 | (293 | ) | (519 | ) | |||||||||||||||
| Net earnings from continuing operations | 695 | 261 | 1,919 | 1,471 | |||||||||||||||||
| Discontinued operations, net of tax | — | 2 | 3 | 2 | |||||||||||||||||
|
Net earnings ( |
695 | 263 | 1,922 | 1,473 | |||||||||||||||||
| Net earnings attributable to noncontrolling interests | (21 | ) | (9 | ) | (48 | ) | (35 | ) | |||||||||||||
|
Net earnings attributable to |
$ | 674 | $ | 254 | $ | 1,874 | $ | 1,438 | |||||||||||||
|
Amounts attributable to |
|||||||||||||||||||||
| Net earnings from continuing operations | $ | 674 | $ | 252 | $ | 1,871 | $ | 1,436 | |||||||||||||
| Discontinued operations, net of tax | — | 2 | 3 | 2 | |||||||||||||||||
|
Net earnings attributable to |
$ | 674 | $ | 254 | $ | 1,874 | $ | 1,438 | |||||||||||||
|
Basic earnings per share attributable to |
|||||||||||||||||||||
| Continuing operations | $ | 1.67 | $ | 0.63 | $ | 4.68 | $ | 3.62 | |||||||||||||
| Discontinued operations | — | 0.01 | 0.01 | 0.01 | |||||||||||||||||
| Net earnings | $ | 1.67 | $ | 0.64 | $ | 4.69 | $ | 3.63 | |||||||||||||
|
Diluted earnings per share attributable to |
|||||||||||||||||||||
| Continuing operations | $ | 1.67 | $ | 0.63 | $ | 4.67 | $ | 3.61 | |||||||||||||
| Discontinued operations | — | 0.01 | 0.01 | — | |||||||||||||||||
| Net earnings | $ | 1.67 | $ | 0.64 | $ | 4.68 | $ | 3.61 | |||||||||||||
| Weighted average number of common shares outstanding: | |||||||||||||||||||||
| Basic | 402.4 | 396.9 | 399.9 | 396.5 | |||||||||||||||||
| Diluted | 402.4 | 398.3 | 400.6 | 398.0 | |||||||||||||||||
| Dividends declared per share of Class A and Class B common stock | $ | 0.20 | $ | 0.20 | $ | 0.80 | $ | 1.40 | |||||||||||||
|
|
|||||||||||
|
CONSOLIDATED BALANCE SHEETS |
|||||||||||
|
(Unaudited) |
|||||||||||
| (in millions, except par value) |
2017 |
2016 |
|||||||||
| ASSETS | |||||||||||
| Current assets: | |||||||||||
| Cash and cash equivalents | $ | 1,389 | $ | 379 | |||||||
| Receivables, net | 2,970 | 2,712 | |||||||||
| Inventory, net | 919 | 844 | |||||||||
| Prepaid and other assets | 523 | 587 | |||||||||
| Total current assets | 5,801 | 4,522 | |||||||||
| Property and equipment, net | 978 | 932 | |||||||||
| Inventory, net | 3,982 | 4,032 | |||||||||
|
|
11,665 | 11,400 | |||||||||
| Intangibles, net | 313 | 315 | |||||||||
| Other assets | 959 | 1,307 | |||||||||
| Total assets | $ | 23,698 | $ | 22,508 | |||||||
| LIABILITIES AND EQUITY | |||||||||||
| Current liabilities: | |||||||||||
| Accounts payable | $ | 431 | $ | 453 | |||||||
| Accrued expenses | 869 | 773 | |||||||||
| Participants' share and residuals | 825 | 801 | |||||||||
| Program obligations | 712 | 692 | |||||||||
| Deferred revenue | 463 | 419 | |||||||||
| Current portion of debt | 19 | 17 | |||||||||
| Other liabilities | 434 | 517 | |||||||||
| Total current liabilities | 3,753 | 3,672 | |||||||||
| Noncurrent portion of debt | 11,100 | 11,896 | |||||||||
| Participants' share and residuals | 384 | 358 | |||||||||
| Program obligations | 477 | 311 | |||||||||
| Deferred tax liabilities, net | 294 | 381 | |||||||||
| Other liabilities | 1,323 | 1,349 | |||||||||
| Redeemable noncontrolling interest | 248 | 211 | |||||||||
| Commitments and contingencies | |||||||||||
|
|
|||||||||||
|
Class A common stock, par value |
— | — | |||||||||
|
Class B common stock, par value |
— | — | |||||||||
| Additional paid-in capital | 10,119 | 10,139 | |||||||||
|
|
(20,590 | ) | (20,798 | ) | |||||||
| Retained earnings | 17,124 | 15,628 | |||||||||
| Accumulated other comprehensive loss | (618 | ) | (692 | ) | |||||||
|
Total |
6,035 | 4,277 | |||||||||
| Noncontrolling interests | 84 | 53 | |||||||||
| Total equity | 6,119 | 4,330 | |||||||||
| Total liabilities and equity | $ | 23,698 | $ | 22,508 | |||||||
|
|
|||||||||||
|
CONSOLIDATED STATEMENTS OF CASH FLOWS |
|||||||||||
|
(Unaudited) |
|||||||||||
|
Year Ended |
|||||||||||
| (in millions) | 2017 | 2016 | |||||||||
| OPERATING ACTIVITIES | |||||||||||
|
Net earnings ( |
$ | 1,922 | $ | 1,473 | |||||||
| Discontinued operations, net of tax | (3 | ) | (2 | ) | |||||||
| Net earnings from continuing operations | 1,919 | 1,471 | |||||||||
| Reconciling items: | |||||||||||
| Depreciation and amortization | 223 | 221 | |||||||||
| Feature film and program amortization | 4,739 | 4,568 | |||||||||
| Equity-based compensation | 68 | 163 | |||||||||
| Equity in net earnings and distributions from investee companies | (14 | ) | (83 | ) | |||||||
| Gain on asset sales | (412 | ) | — | ||||||||
| Deferred income taxes | (174 | ) | 254 | ||||||||
| Operating assets and liabilities, net of acquisitions: | |||||||||||
| Receivables | (132 | ) | 149 | ||||||||
| Production and programming | (4,412 | ) | (5,102 | ) | |||||||
| Accounts payable and other current liabilities | (207 | ) | (229 | ) | |||||||
| Other, net | 73 | (41 | ) | ||||||||
| Net cash provided by operating activities | 1,671 | 1,371 | |||||||||
| INVESTING ACTIVITIES | |||||||||||
| Acquisitions and investments, net | (378 | ) | (58 | ) | |||||||
| Capital expenditures | (195 | ) | (172 | ) | |||||||
| Proceeds received from asset sales | 848 | — | |||||||||
| Grantor trust proceeds/(contributions) | 54 | (69 | ) | ||||||||
| Net cash provided by/(used in) investing activities | 329 | (299 | ) | ||||||||
| FINANCING ACTIVITIES | |||||||||||
| Borrowings | 2,569 | — | |||||||||
| Debt repayments | (3,352 | ) | (368 | ) | |||||||
| Purchase of treasury stock | — | (100 | ) | ||||||||
| Dividends paid | (319 | ) | (635 | ) | |||||||
| Excess tax benefits on equity-based compensation awards | 1 | — | |||||||||
| Exercise of stock options | 172 | 11 | |||||||||
| Other, net | (81 | ) | (81 | ) | |||||||
| Net cash used in financing activities | (1,010 | ) | (1,173 | ) | |||||||
| Effect of exchange rate changes on cash and cash equivalents | 20 | (26 | ) | ||||||||
| Net change in cash and cash equivalents | 1,010 | (127 | ) | ||||||||
| Cash and cash equivalents at beginning of period | 379 | 506 | |||||||||
| Cash and cash equivalents at end of period | $ | 1,389 | $ | 379 | |||||||
SUPPLEMENTAL DISCLOSURES REGARDING NON-GAAP FINANCIAL INFORMATION
The following tables reconcile our results for the quarter and year
ended
| (in millions, except per share amounts) | ||||||||||||||||||||||||||
|
Quarter Ended |
||||||||||||||||||||||||||
| Operating Income |
Earnings from |
Provision for |
Net Earnings
Attributable to |
Diluted EPS |
||||||||||||||||||||||
| Reported results (GAAP) | $ | 705 | $ | 571 | $ | (124 | ) | $ | 674 | $ | 1.67 | |||||||||||||||
| Factors Affecting Comparability: | ||||||||||||||||||||||||||
| Gain on asset sale (3) | (127 | ) | (127 | ) | (20 | ) | (96 | ) | (0.24 | ) | ||||||||||||||||
| Discrete tax benefit (6) | — | — | 268 | (268 | ) | (0.66 | ) | |||||||||||||||||||
| Adjusted results (Non-GAAP) | $ | 578 | $ | 444 | $ | 124 | $ | 310 | $ | 0.77 | ||||||||||||||||
|
Year Ended |
||||||||||||||||||||||||||
|
Operating |
Earnings from |
Provision for |
Net Earnings |
Diluted EPS |
||||||||||||||||||||||
| Reported results (GAAP) | $ | 2,489 | $ | 2,212 | $ | 293 | $ | 1,871 | $ | 4.67 | ||||||||||||||||
| Factors Affecting Comparability: | ||||||||||||||||||||||||||
| Restructuring and programming charges (2) | 381 | 381 | 135 | 246 | 0.61 | |||||||||||||||||||||
| Gain on asset sales (3) | (127 | ) | (412 | ) | (116 | ) | (285 | ) | (0.71 | ) | ||||||||||||||||
| Loss on extinguishment of debt (4) | — | 20 | 7 | 13 | 0.03 | |||||||||||||||||||||
| Investment impairment (5) | — | 10 | 4 | 6 | 0.01 | |||||||||||||||||||||
| Discrete tax benefit (6) | — | — | 340 | (340 | ) | (0.84 | ) | |||||||||||||||||||
| Adjusted results (Non-GAAP) | $ | 2,743 | $ | 2,211 | $ | 663 | $ | 1,511 | $ | 3.77 | ||||||||||||||||
|
Quarter Ended |
||||||||||||||||||||||||||
|
Operating |
Earnings from |
Provision for |
Net Earnings |
Diluted EPS |
||||||||||||||||||||||
| Reported results (GAAP) | $ | 332 | $ | 178 | $ | (83 | ) | $ | 252 | $ | 0.63 | |||||||||||||||
| Factors Affecting Comparability: | ||||||||||||||||||||||||||
| Restructuring (7) | 206 | 206 | 75 | 131 | 0.33 | |||||||||||||||||||||
| Discrete tax benefit (8) | — | — | 110 | (110 | ) | (0.27 | ) | |||||||||||||||||||
| Adjusted results (Non-GAAP) | $ | 538 | $ | 384 | $ | 102 | $ | 273 | $ | 0.69 | ||||||||||||||||
|
Year Ended |
||||||||||||||||||||||||||
|
Operating |
Earnings from |
Provision for |
Net Earnings |
Diluted EPS |
||||||||||||||||||||||
| Reported results (GAAP) | $ | 2,526 | $ | 1,990 | $ | 519 | $ | 1,436 | $ | 3.61 | ||||||||||||||||
| Factors Affecting Comparability: | ||||||||||||||||||||||||||
| Restructuring (7) | 206 | 206 | 75 | 131 | 0.33 | |||||||||||||||||||||
| Discrete tax benefit (8) | — | — | 102 | (102 | ) | (0.26 | ) | |||||||||||||||||||
| Adjusted results (Non-GAAP) | $ | 2,732 | $ | 2,196 | $ | 696 | $ | 1,465 | $ | 3.68 | ||||||||||||||||
(1) The tax impact has been calculated by applying the tax rates applicable to the adjustments presented.
(2) We recognized pre-tax restructuring and programming charges of
(3) In the quarter and year ended
(4) We redeemed senior notes and debentures totaling
(5) During the year ended
(6) The net discrete tax benefit in the quarter ended
(7) We recognized a pre-tax charge restructuring charge of
(8) The net discrete tax benefit in the quarter and year ended
The following table includes a reconciliation of net cash provided by operating activities (GAAP) to free cash flow and operating free cash flow (non-GAAP). We define free cash flow as net cash provided by operating activities minus capital expenditures, plus excess tax benefits from equity-based compensation awards (actual tax deductions in excess of amounts previously recognized, which is included within financing activities in the statement of cash flows), as applicable. We define operating free cash flow as free cash flow, excluding the impact of the cash premium on the extinguishment of debt, as applicable. Free cash flow and operating free cash flow are non-GAAP measures. Management believes the use of these measures provides investors with an important perspective on, in the case of free cash flow, our liquidity, including our ability to service debt and make investments in our businesses, and, in the case of operating free cash flow, our liquidity from ongoing activities.
|
Reconciliation of net cash provided by operating activities
to free cash flow and operating free cash flow (in millions) |
Quarter Ended |
Better/ (Worse) |
Year Ended |
Better/ (Worse) |
|||||||||||||||||||||||||||
| 2017 | 2016 | $ | 2017 | 2016 | $ | ||||||||||||||||||||||||||
| Net cash provided by operating activities (GAAP) | $ | 1,018 | $ | 971 | $ | 47 | $ | 1,671 | $ | 1,371 | $ | 300 | |||||||||||||||||||
| Capital expenditures | (56 | ) | (92 | ) | 36 | (195 | ) | (172 | ) | (23 | ) | ||||||||||||||||||||
| Excess tax benefits | — | — | — | 1 | — | 1 | |||||||||||||||||||||||||
| Free cash flow (Non-GAAP) | 962 | 879 | 83 | 1,477 | 1,199 | 278 | |||||||||||||||||||||||||
| Debt retirement premium | — | — | — | 33 | — | 33 | |||||||||||||||||||||||||
| Operating free cash flow (Non-GAAP) | $ | 962 | $ | 879 | $ | 83 | $ | 1,510 | $ | 1,199 | $ | 311 | |||||||||||||||||||
View source version on businesswire.com: http://www.businesswire.com/news/home/20171116005398/en/
Press:
Vice President, Corporate Communications and Corporate
Affairs
jeremy.zweig@viacom.com
or
Senior Manager, Corporate Communications
alex.rindler@viacom.com
Investors:
Senior Vice President, Investor Relations
james.bombassei@viacom.com
or
Vice President, Investor Relations
kareem.chin@viacom.com
Source:
News Provided by Acquire Media